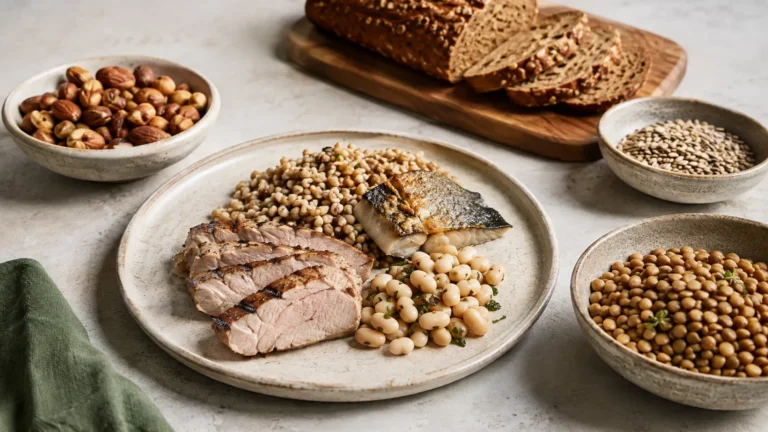

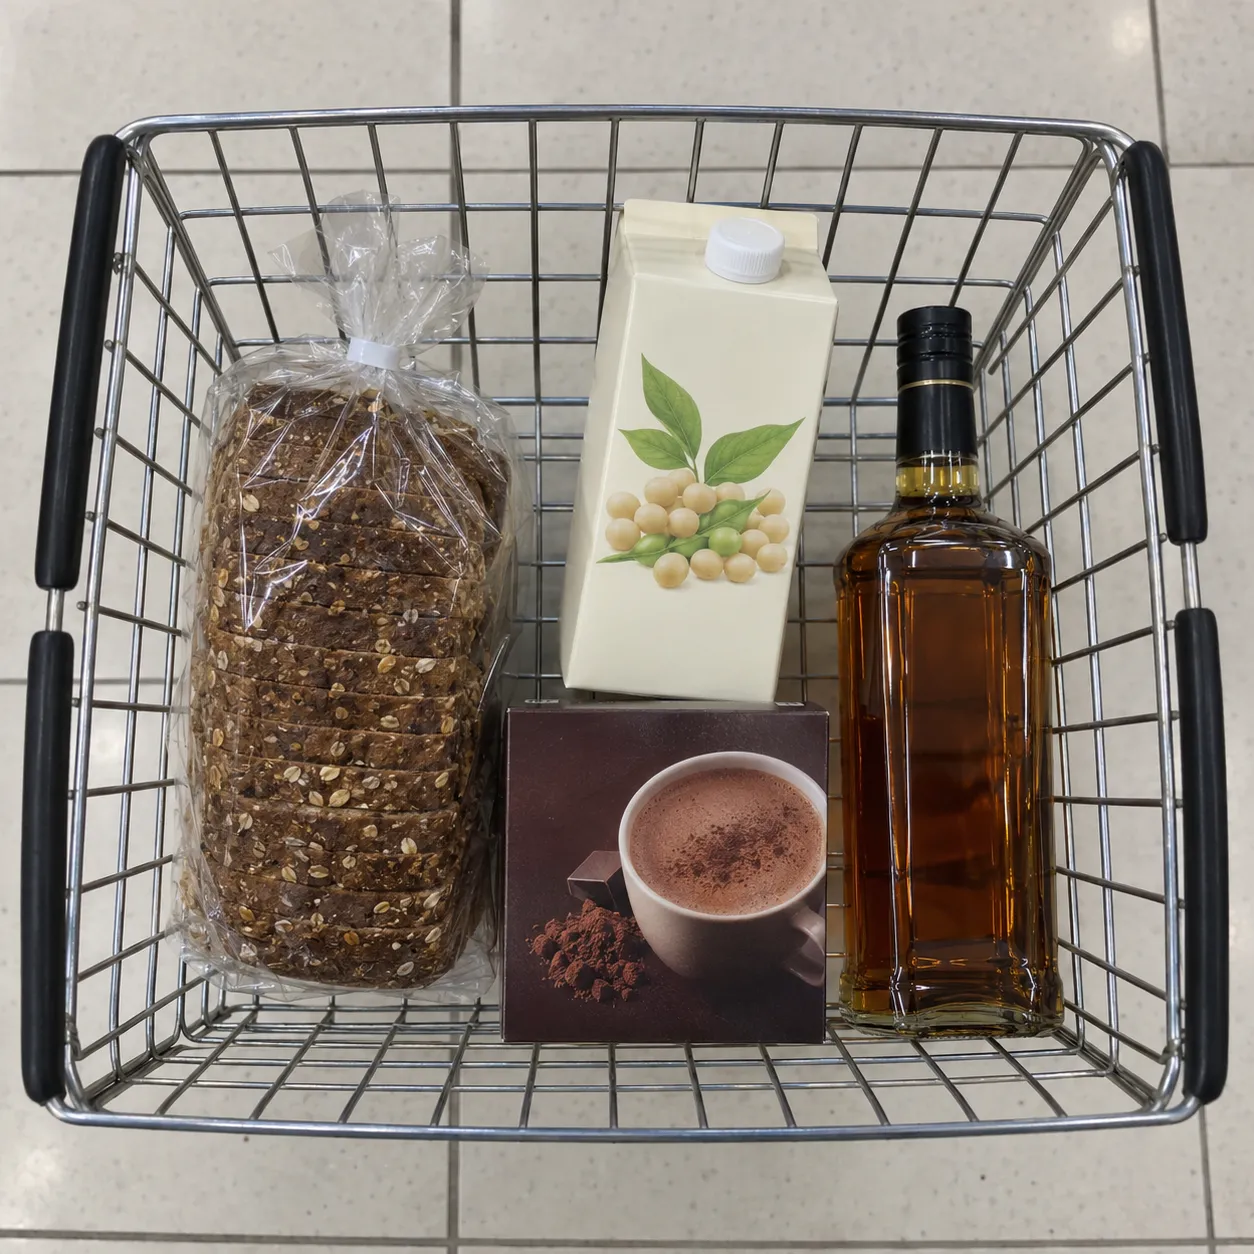
Soy milk. Dark bread. Refried beans. Liquor.
Those are all on the ultra-processed list in the study behind every headline you saw this spring.
Which tells you something before you read a single number. This category is stranger than the word suggests. And the risk starts a lot earlier than “nine servings a day.”
Quick answer: There is no safe limit. But in this study, people eating more than about 1.1 servings a day had a 41% higher risk of a major cardiac event. The average person ate 4.38 servings.
What Did The Study Find?

Researchers followed 6,531 US adults aged 45 to 84. None of them had heart disease at the start.
The group was mixed on purpose. 39% white, 27% Black, 22% Hispanic, 12% Chinese. Most earlier work on this was done in white or European groups.
They tracked people for up to 20 years. That came to 83,870 person-years and 710 cardiac events. Heart attacks, cardiac arrests, strokes, and deaths from either.
The average person ate 4.38 servings of ultra-processed food a day. Down at the bottom fifth, it was 1.14. Up at the top fifth, 9.30.
The top fifth had a 66.8% higher risk than the bottom fifth.
That held up after the researchers accounted for a lot. Age, sex, race, education, income, smoking, exercise and total calories. Then diet quality, diabetes, cholesterol, blood pressure and waist size.
That last part is the point. It is not just that these people ate badly overall. Something about the processing itself tracked with risk.
So why would processing matter on its own? The researchers list a few possible routes. These foods are easy to overeat. They may shift the bacteria in your gut. And they may interfere with the signals that tell your brain you have had enough. That last one runs on the same appetite system behind all the GLP-1 talk. None of it is settled.
What Actually Counts As Ultra-Processed?
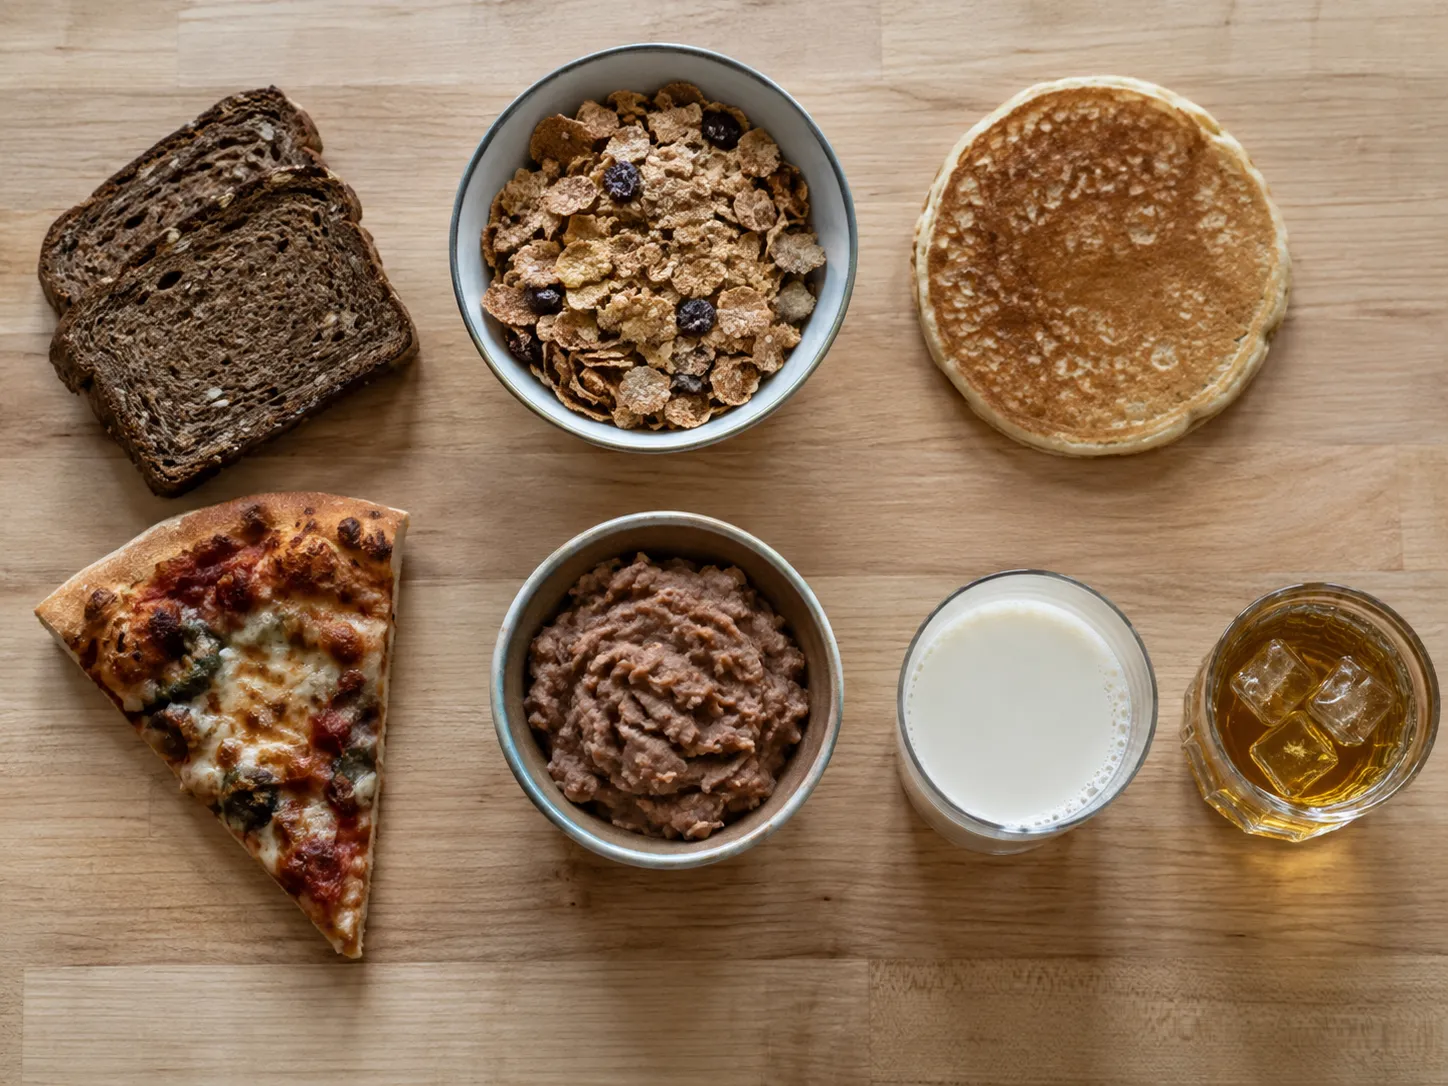
Here is the full list the researchers used. Read it properly, because it is not what you expect.
Sausage. Pancakes. Hot cereal. Cold cereal. White bread. Dark bread. Muffins. Biscuits. Margarine on rolls. Chips. Crackers. French fries. Oriental noodles. Dumplings. Chow mein. Refried beans. Pizza. Hamburger. Hamhocks. Fried chicken. Fried fish. Ice cream. Frozen yogurt. Tofu dessert. White donuts. Chocolate donuts. Pies. Pudding. Candy. Sweet milk. Soy milk. Soda. Diet soda. Instant breakfast. Hot cocoa. Liquor.
Liquor. Soy milk. Dark bread. Dumplings.
And some of these are arguable. Take refried beans. Under NOVA’s own rules, beans plus salt is Group 3, a processed food. Group 4 is meant for industrial formulations, the ones with protein isolates, modified starches and emulsifiers.
So one tin of refried beans is Group 3 and another is Group 4, depending entirely on the label. The questionnaire just said “refried beans.” Somebody had to pick a bucket.
That is a known problem. Researchers once asked food and nutrition specialists to sort the same foods using NOVA, and they did not agree with each other. The paper was called “how functional is the NOVA system?”
That is the NOVA system. It sorts food by how much processing it went through, not by what is in it. Two investigators sorted every item independently, then compared notes and settled disagreements with a senior researcher.
So when a headline says ultra-processed food raises heart risk, this is the pile it is talking about. It is not just chips and soda.
And that matters, because most people reading these headlines picture a vending machine. The study was measuring something much broader. It is the same trap as a label that sounds precise until you check what it covers.

The 5 most toxic items in your bathroom, kitchen, and bedroom.
Find out which to fix first, free.
Instant access. No account needed.
What Counts As One Serving?
This is the other thing nobody reported.
Everyone filled out a 120-item food questionnaire once, at the start. It asked how often they ate each item. Then it asked whether their usual portion was small, medium or large.
Servings per day came from multiplying those two answers together.
Nothing was weighed. Nobody counted grams. No package labels were involved.
The researchers flag this themselves. They write that the questionnaire was never built to answer questions about food processing. And that items may have been sorted wrong. They also note the lack of any weight or calorie based measure as a limitation.
So treat 9.3 as a rough marker, not a line in the sand.
Does That Make The Finding Useless?
No, and two things in the paper are worth knowing here.
First, they checked whether people kept eating the same way. They compared intake in 2000 to 2002 against intake in 2010 to 2012. There was no significant change. So the baseline questionnaire was a decent stand-in for how these people ate over the long run.
Second, they reran everything with different versions of the ultra-processed variable, dropping the items that were ambiguous or barely contributed. That is the refried beans problem, and they tested for it. Nothing changed.
The measurement is rough. The pattern survived it anyway.
Where Does The Risk Actually Start?
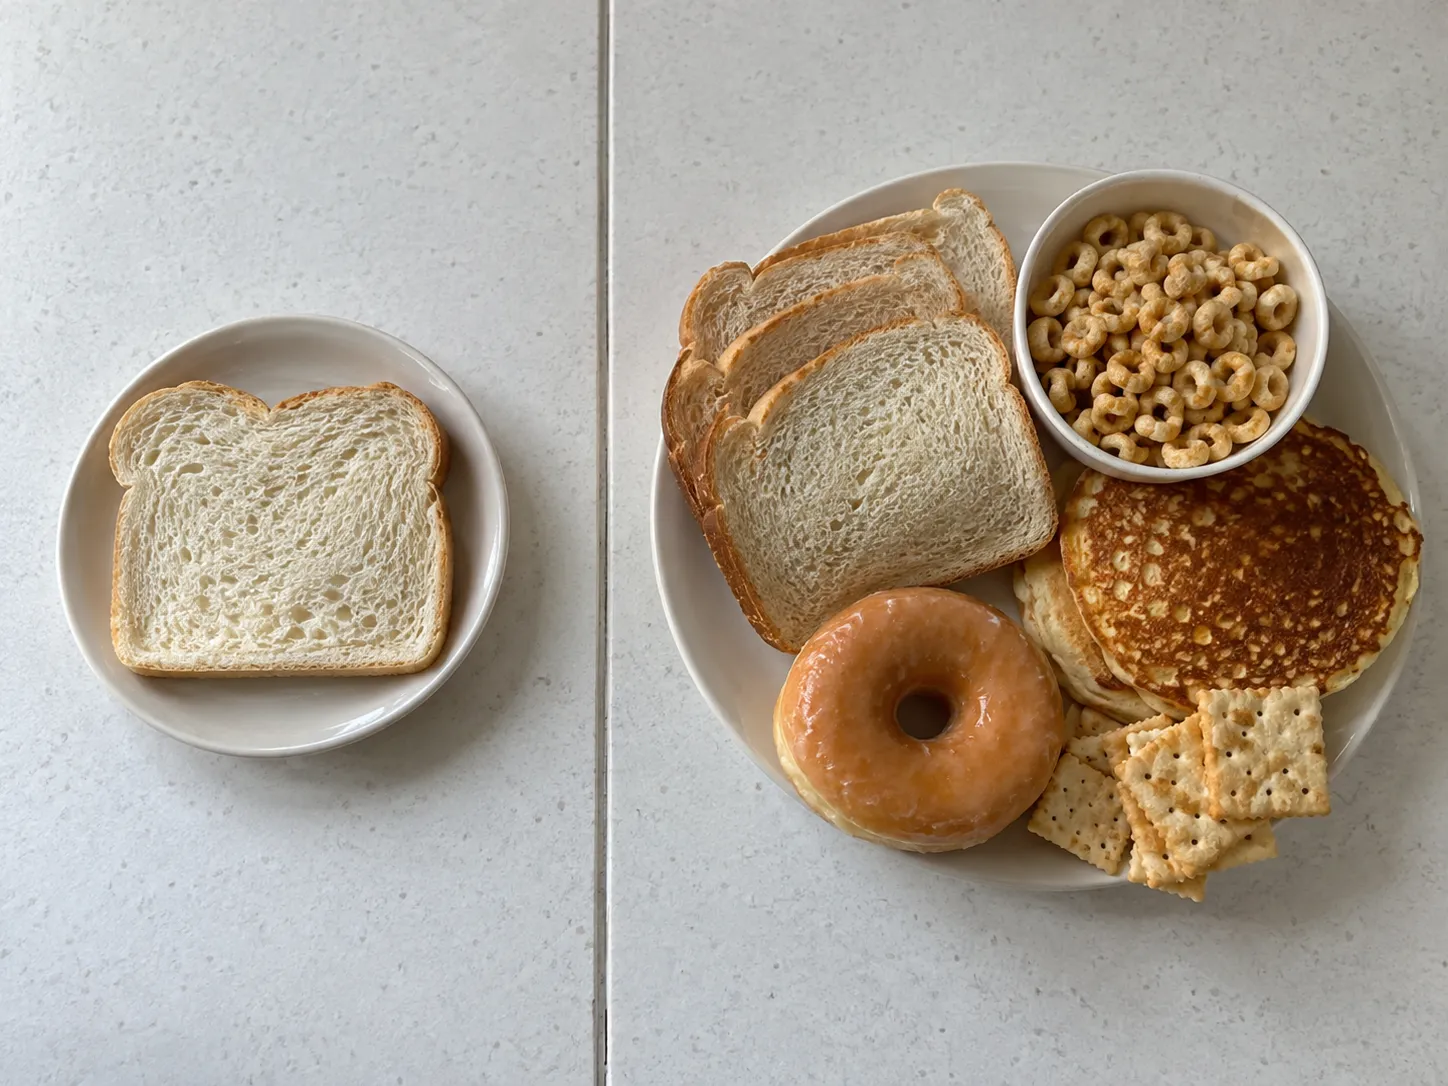
Here is the line that should have been the headline.
Compare the bottom fifth, who ate about 1.14 servings a day, against everyone else in the study combined. Everyone else had a 41% higher risk of a cardiac event.
Not the top fifth. The other 80%.
The average was 4.38 servings. So by the time you reach ordinary intake, most of the gap has already opened.
| Group | Servings per day | Risk vs the lowest fifth |
|---|---|---|
| Bottom fifth | 1.14 | Reference |
| Everyone else | above 1.14 | 41% higher |
| Top fifth | 9.30 | 66.8% higher |
The researchers also mapped the curve. It climbed steadily and in a roughly straight line. At the far end, around 30 servings a day, risk reached nearly four times that of the lowest intake.
Which Foods Carried The Risk?

They broke the category apart, and the result is not what you would guess.
Sugary foods were the only group with a clear link to higher risk.
Meats came close but did not quite reach significance.
Bread and cereals looked linked in the simpler models, then faded once everything was accounted for.
And here is the surprise. Sugar-sweetened beverages showed no significant link. Neither did savory foods or mixed dishes.
That last one runs against almost every piece of nutrition advice you have read. It does not mean soda is fine. Subgroups are smaller, so they are harder to read. And the researchers say plainly that nobody has agreed on how to split this category up yet.
But if you are going to be honest about what this study found, sugary foods is where the signal was. Not drinks.
This keeps happening. Chips and french fries are both on the list above, and the research on potatoes and blood sugar ran into the same thing. One preparation carried almost all the risk. The rest of the category came along for the ride.
What About The Finding In Black Americans?
The link was stronger among Black participants. Each extra daily serving came with a 6.1% higher risk for Black Americans versus 3.2% for everyone else.
Ultra-processed food was 32% of daily servings among Black participants. It was 30% among white, 24% among Hispanic and 19% among Chinese participants.
The researchers were direct about how to read this. Systemic factors rooted in historical racism, rather than any biological difference, are the likely explanation. They pointed to food companies targeting Black and Hispanic consumers with marketing for high-calorie, low-nutrient products.
They also told readers to be careful with it. Splitting a group into smaller groups makes the numbers shakier. They said their ability to spot real differences between races may have been limited. Their own words: interpret with caution.
Worth adding that the study found no link with sex or income either way.
What This Study Does NOT Prove
This was an observational study. Researchers watched what happened. Nobody was told what to eat.
It does not prove ultra-processed food causes heart attacks. Nor does it prove that cutting back lowers your risk. And it does not set a safe limit, because a serving here was self-reported rather than measured.
What it does show is a steady, stepped relationship in a large and varied US group. One that survived every adjustment they threw at it. It also matched what earlier US and European studies found.
That is worth acting on. It is just not a rule to follow. The same gap between a real finding and a usable number shows up in the research on vitamin D and brain health.
What Should You Actually Do?
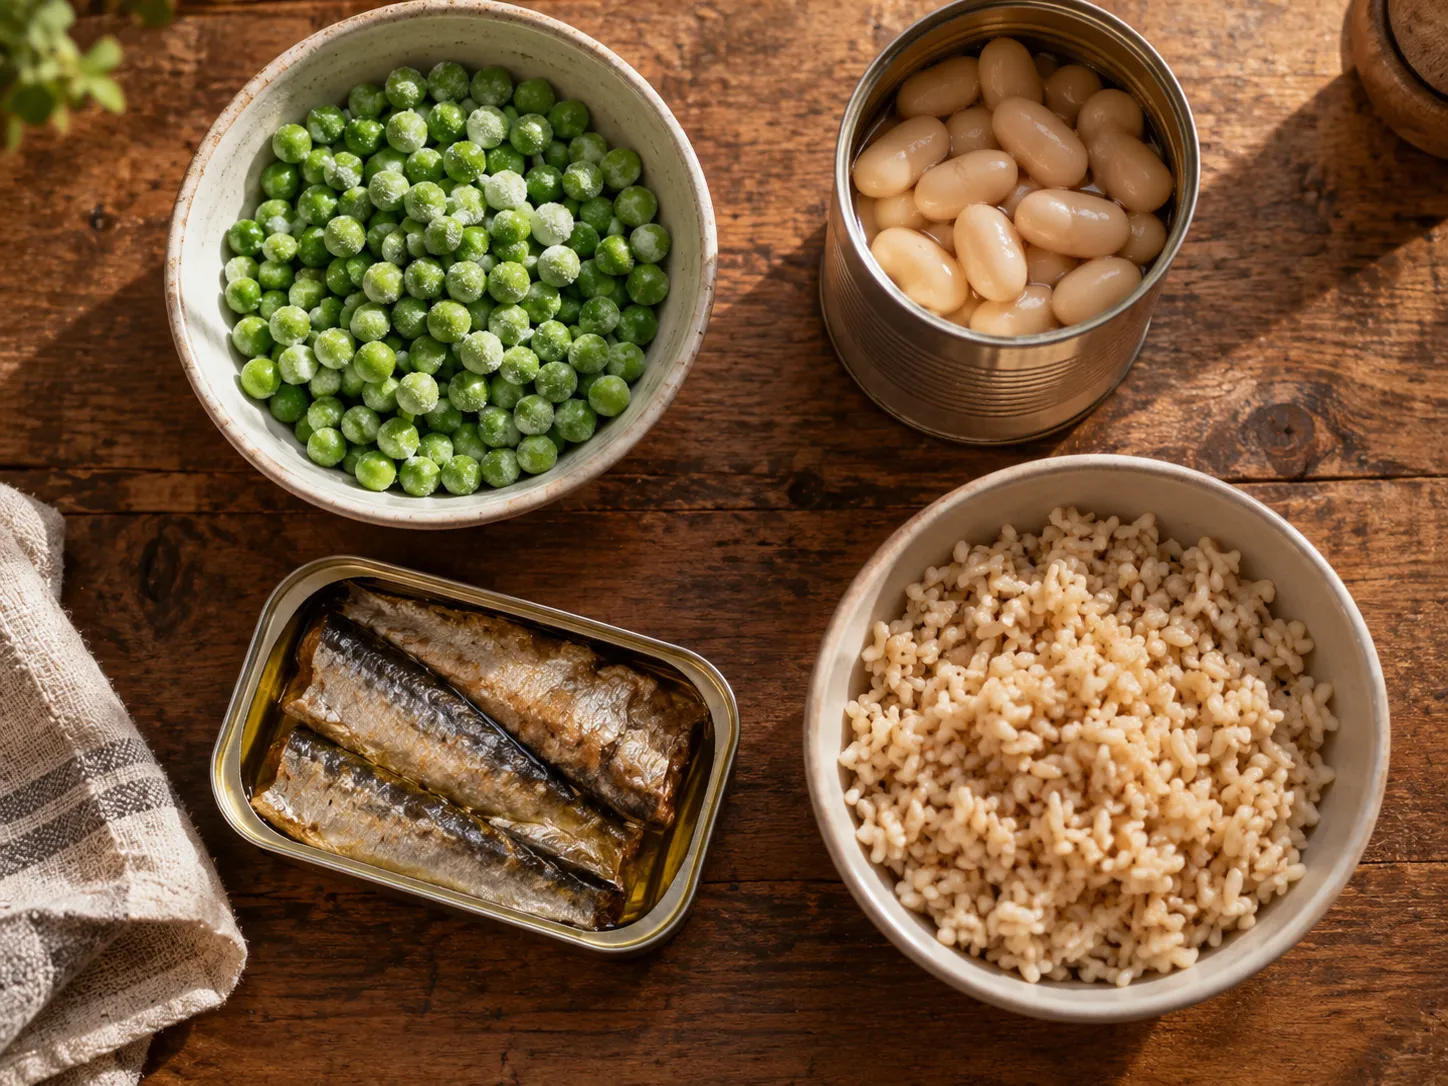
Stop counting servings. The unit is too rough to count.
Think in share of your plate instead. Ultra-processed items were 28% of daily food servings on average here, and 41% among the heaviest eaters. That framing is closer to what the study measured.
Three things worth more than any number:
Go after sweets first. Sugary foods were the one category with a clear signal.
Do not panic about the whole list. Frozen vegetables, plain canned beans, tinned fish and pre-cooked rice sit nowhere near the ultra-processed end, whatever a questionnaire had to call them. Convenience was never the problem.
Read the ingredients list, not the front of the box. Added sugar, salt and fat run higher in these products. The ingredients list is where that shows up.
Frequently Asked Questions
How much ultra-processed food is too much?
No study has set a safe limit. In this one, everyone above about 1.1 servings a day had 41% higher risk than those below it. But “serving” was self-reported. Treat it as a rough marker, not a threshold.
What counts as ultra-processed food?
More than you think. This study’s list included white and dark bread, hot and cold cereal, pancakes and pizza. Also fried chicken, refried beans, dumplings, soy milk, ice cream, candy, soda and liquor. Some of those are debatable. Under NOVA, canned beans with nothing but beans and salt are a Group 3 processed food, not ultra-processed.
Is all ultra-processed food equally bad?
No. Sugary foods were the only category clearly linked to higher cardiac risk here. Sugar-sweetened drinks, savory foods and mixed dishes showed no significant link.
Does ultra-processed food cause heart disease?
Not proven. This was observational, so it shows a link and not cause and effect. The link did survive adjustment for calories, diet quality, diabetes, blood pressure, cholesterol, smoking, exercise and waist size.
Is frozen food ultra-processed?
Depends on the item. Plain frozen fruit and veg are barely processed. A frozen ready meal usually is not.
Is bread ultra-processed?
Most supermarket bread is, under the NOVA system. Both white and dark bread were on this study’s list. In the results, bread and cereals lost their link to risk once everything else was accounted for.
Why use questionnaires instead of measuring what people eat?
Because tracking what thousands of people really eat, for twenty years, is close to impossible. Questionnaires are what make big studies affordable. Precision is what they cost.
The Takeaway
The finding is solid enough to act on. The number is not precise enough to count.
Nine servings a day was never the line. Most of the gap had opened well before that. And the sugary end of the category is where the evidence is sharpest.
And the category itself is bigger, weirder and blurrier than the word suggests. If dark bread and a tin of beans are on the list, then “avoid ultra-processed food” is not really advice. It is a slogan.
Eat fewer sweets. Cook a bit more. Stop counting.
Sources / Research Notes
All figures taken directly from the published paper: Haidar A, Rikhi R, Watson KE, Wood AC, Shapiro MD. Association Between Ultraprocessed Food Consumption and Cardiovascular Disease Risk: MESA (Multiethnic Study of Atherosclerosis). JACC: Advances, April 2026;5(4):102516 (doi:10.1016/j.jacadv.2025.102516), open access. Food list from the Methods section. Risk figures from Table 2 and Table 3. Subgroup results from the exploratory analyses. Limitations and the authors’ caution on race-stratified findings are quoted from their own Limitations section. Ultra-processed classification per the Nova system, Monteiro et al., Public Health Nutrition 2019.